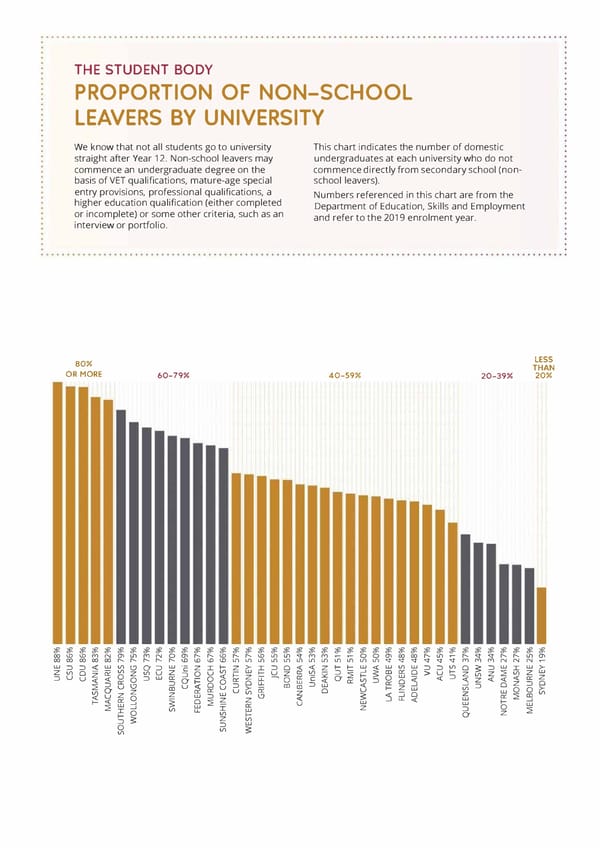
THE STUDENT BODY PROPORTION OF NON-SCHOOL LEAVERS BY UNIVERSITY We know that not all students go to university This chart indicates the number of domestic straight after Year 12. Non-school leavers may undergraduates at each university who do not commence an undergraduate degree on the commence directly from secondary school (non basis of VET qualifications, mature-age special school leavers). entry provisions, professional qualifications, a Numbers referenced in this chart are from the higher education qualification (either completed Department of Education, Skills and Employment or incomplete) or some other criteria, such as an and refer to the 2019 enrolment year. interview or portfolio. LESS 80% THAN OR MORE 60-79% 40-59% 20-39% 20% I '3 '3 '3 '3 '3 '3 '3 ';ff!. ?f!. '3 '3 '3 '3 '3 '3 '3 '3 '3 '3 � '3 '3 '3 '3 '3 '3 '3 '3 '3 '3 '3 '3 '3 '3 '3 '3 '3 '3 '3 00 I.!) I.!) CC) N °' Lt) CCl N 0 °' r-- r-- I.!) r-- r-- I.!) Lt) Lt) <:I" CC) CC) 0 0 °' 00 00 r-- Lt) r-- <:I" <:I" r-- r-- Lt) °' 00 00 00 00 00 r-- r-- r-- r-- r-- I.!) I.!) I.!) I.!) Lt) Lt) Lt) Lt) Lt) L1) Lt) Lt) U) U) Lt) Lt) 'SI" 'SI" 'SI" 'SI" 'SI" � CC) CC) CC) N N N w w Vl w I- >- I- I- w w Vl w Vl w w >- ::) ::) l.'J CY ::) z I z I ::) 0 <( z <( ::) ::) 0 ::) I :o:,:; ·c � Vl Vl w _J et: I- w Vl � Vl ::) - CD 0 Vl z 0 ii'. Vl u z u u > u z z ::) 0 t:: z z Vl z 2 z Q 2 I- � w 0 w <( � z et: ::) z ::) u ::) et: 0 <( <( et: u <( 0 et: LL ·c a <( <( <( 0 �a Vl ::) <( z <( a� w <( et: et: 0 0 ::) 0 LL et: _J z ::) 0 ::) ::) w _J 0 0 ::) CD <( ::) u l.'J u <( u CD 2 CD >- I- z w Vl >- et: u ii'. 0 u 0 0 a z et: Vl w Vl Vl z z w :::; 0 z z w CD u ::) l.'J <( et: 2 � LL w 0 < _J et: z z <( ;:: <( _J 0 w I- 2 u w w w � et: _J w I z 0 2 Vl w ::) I LL 2 0 Vl z I- a I- z Vl ::) � w ::) 0 Vl � Vl
 The Good Universities Guide 2022 Page 8 Page 10