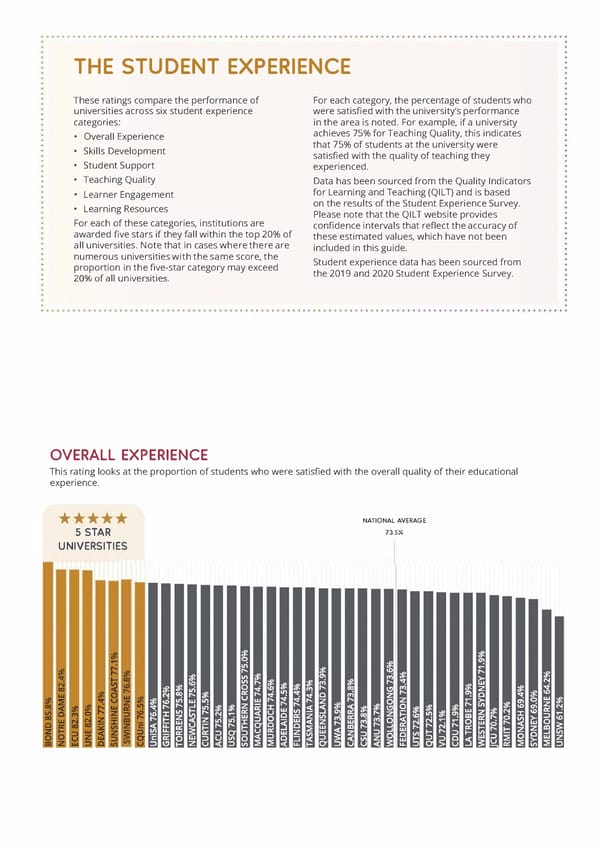
THE STUDENT EXPERIENCE These ratings compare the performance of For each category, the percentage of students who universities across six student experience were satisfied with the university's performance categories: in the area is noted. For example, if a university achieves 75% for Teaching Quality, this indicates • Overall Experience that 75% of students at the university were • Skills Development satisfied with the quality of teaching they • Student Support experienced. • Teaching Quality Data has been sourced from the Quality Indicators for Learning and Teaching {QILT) and is based Learner Engagement on the results of the Student Experience Survey. • Learning Resources Please note that the QILT website provides For each of these categories, institutions are confidence intervals that reflect the accuracy of awarded five stars if they fall within the top 20% of these estimated values, which have not been all universities. Note that in cases where there are included in this guide. numerous universities with the same score, the Student experience data has been sourced from proportion in the five-star category may exceed the 2019 and 2020 Student Experience Survey. 20% of all universities. OVERALL EXPERIENCE This rating looks at the proportion of students who were satisfied with the overall quality of their educational experience. ***** NATIONAL AVERAGE 73.5% 5 STAR UNIVERSITIES
 The Good Universities Guide 2022 Page 18 Page 20